The brief
From 2023 to 2025, Juan owned paid acquisition end to end for a multi-brand US DTC health company — strategy, budgets and revenue accountability across Meta, Google and native channels. Around $40M in paid media passed through that seat over two years.
The company's problem wasn't traffic; it was efficiency. Revenue sat around $800K a month, and every channel reported its own inflated version of success — the classic trap where Meta, Google and native each claim the same sale, and nobody knows what's actually working.
The operating system
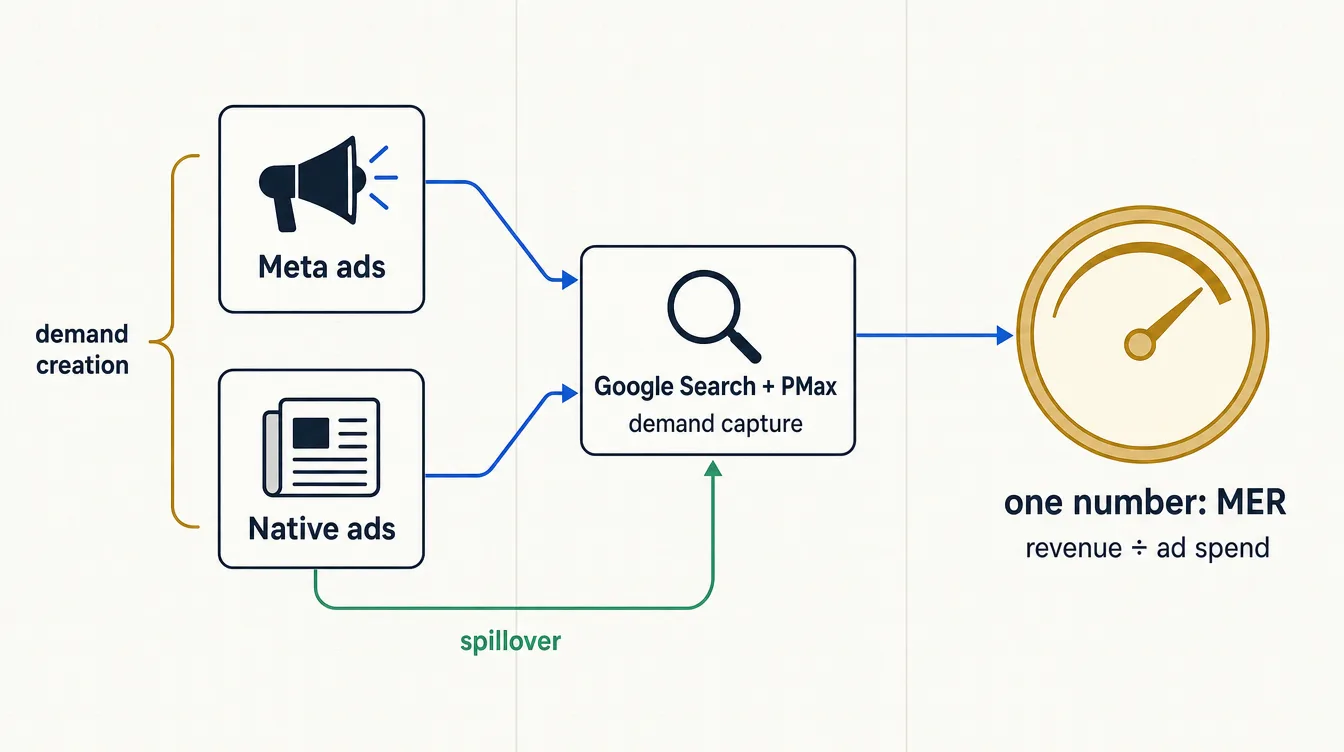
- One number above all: MER — total revenue divided by total ad spend. Platform dashboards flatter themselves; MER can't. Budgets moved weekly based on blended contribution, not on whichever platform claimed the credit.
- Demand creation vs. demand capture — Meta and native to create demand, Google Search and Performance Max to capture it, each judged by its role instead of the same metric.
- A creative testing engine shipping 30–50 new ad assets per month, tagged by angle and hook so winners were found systematically — with AI-assisted iteration to keep the velocity up.
- Full-funnel segmentation that lifted conversion rate by 19%, and forecasting and pacing models so spend scaled only after acquisition costs proved stable.
The native arm, documented
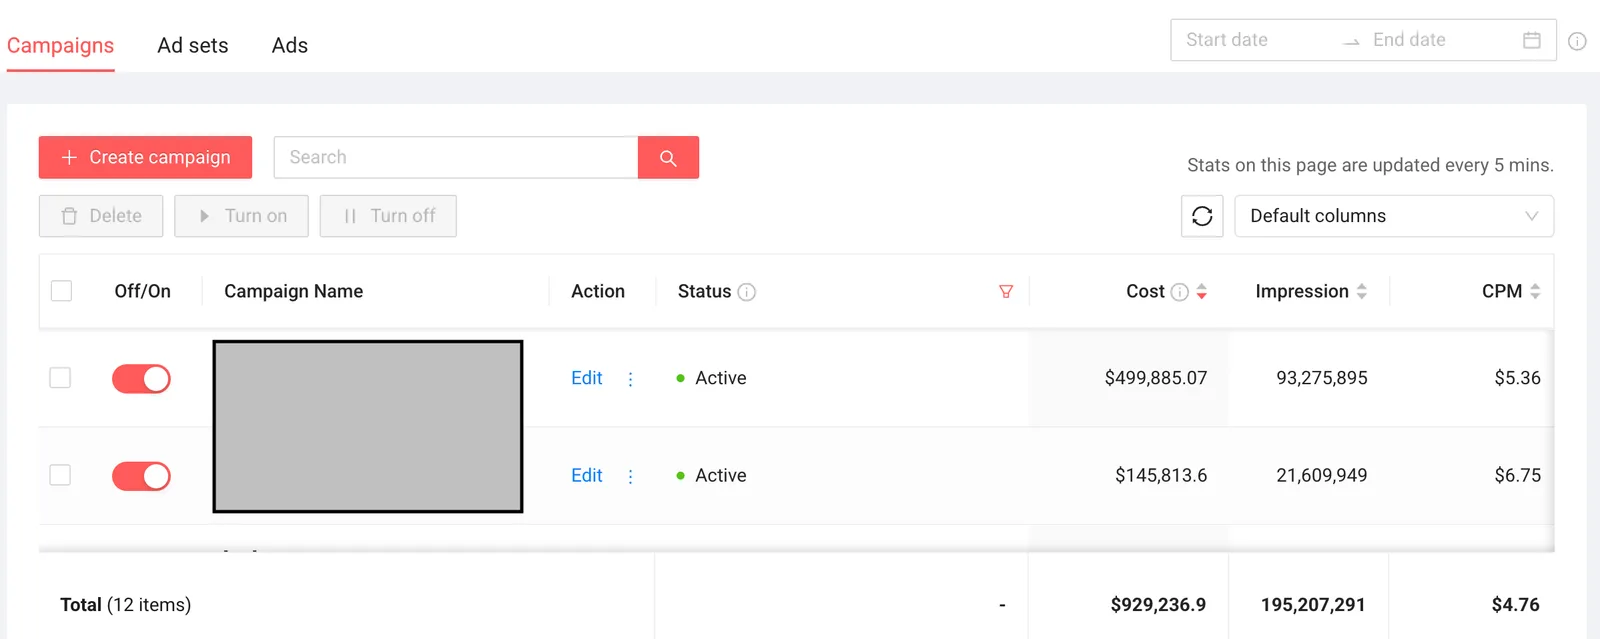
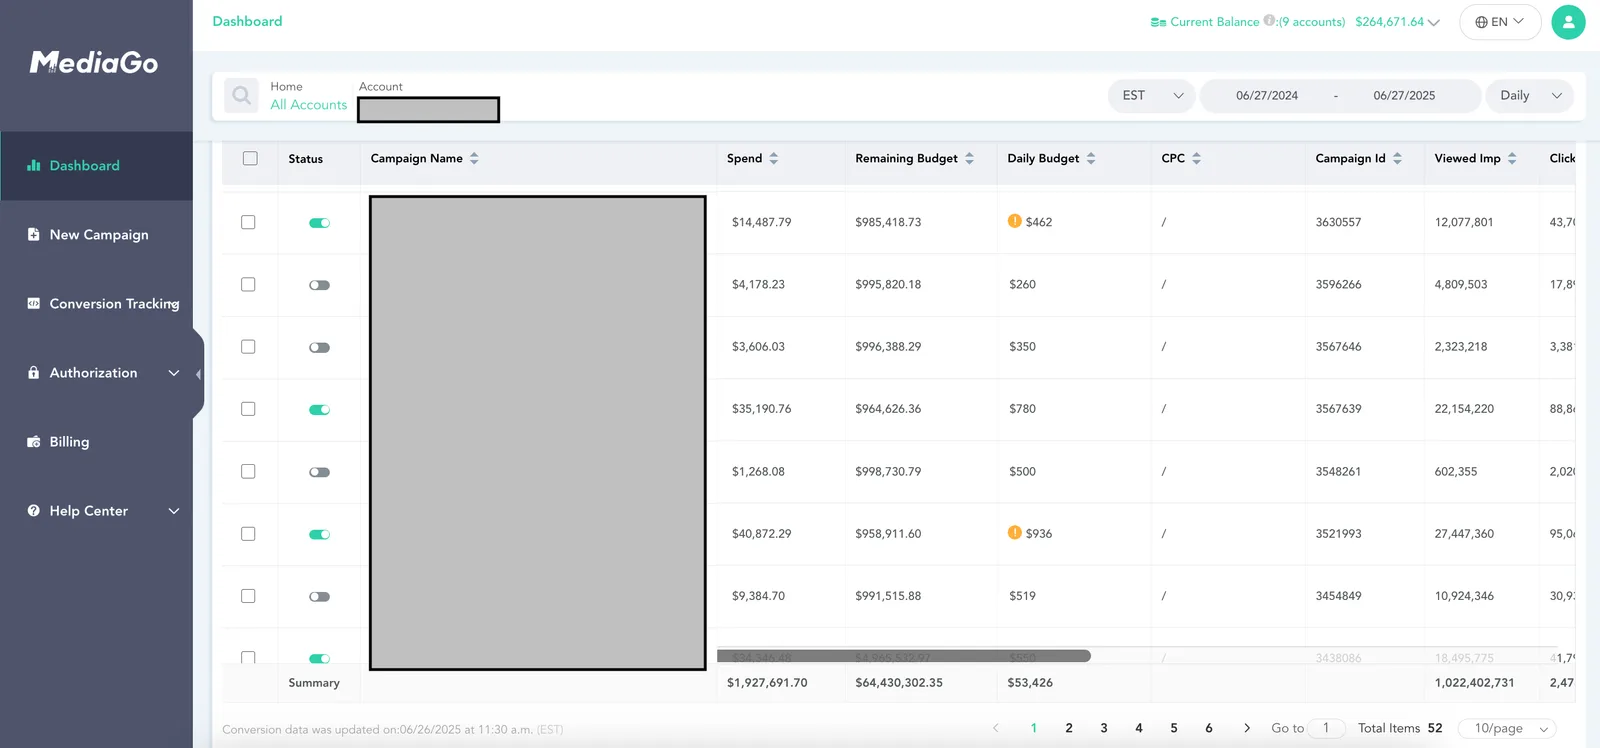
The third leg of the machine — native advertising — is the least visible from the outside, so here it is: two of the platform dashboards from the portfolio's native program.
The result
Monthly revenue grew from $800K to $2.4M — 3x — while MER improved from 2.3 to 3.7 within nine months of the operating system landing. Blended acquisition cost dropped 22–35% depending on the brand. Growth that came from better economics, not just bigger budgets.
The honest reading
“3x revenue” is a company result, not a media-buying result alone. Product, offer and retention teams all contributed. What the acquisition seat owned — and what these numbers document — is the efficiency side: the same dollar buying more customers (MER 2.3 → 3.7, CAC down 22–35%) while total volume tripled. That distinction is exactly the kind your reports should make.
What this proves for your business
This is the multi-channel version of what Irgella builds: one system where every channel has a job, one honest number above the platform scoreboards, creative treated as a production line, and scale unlocked only when the economics hold. It works at $40M — and the discipline is the same at $4K.
Figures from platform dashboards and internal revenue reporting for the 2023–2025 tenure. Company and brand names withheld under confidentiality.
Prefer Spanish? The teaching teardown of this case lives in the founder's free library: magoallegri.com — caso-salud-multicanal.