The starting line: zero
A US brand selling a heart-health supplement — a ceremonial-grade cacao positioned around arterial plaque and blood pressure — brought Juan in on a revenue-share deal. When he arrived there were no campaigns, no creatives, no funnel. And no team: research, copy, creative production, campaign architecture and daily optimization were all one person's job for the entire 12+ month engagement.
Health supplements are among the hardest categories on Meta: strict policies around medical claims, accounts that get flagged fast, and a 55–65+ buyer who has been sold to their whole life and doesn't trust ads. There was no proven playbook to copy.
What didn't work (and what the flop taught)
The first months were rough. Standard supplement ads — product shots, benefit headlines, the usual DTC playbook — flopped: acquisition costs were far too high and engagement told the same story. The fix didn't come from new ads. It came from stepping back into research: weeks reading cardiovascular health forums, mapping what real people said about their fears, their frustration with medications, what kept them up at night.
Three emotional drivers came out of that research and became the foundation of everything after:
- Fear of stroke-induced disability — not death; losing independence. Why they buy.
- Frustration with treatments that failed them — feeling dismissed by the system. Why they buy now.
- The desire to feel “clean inside” — to actively undo years of buildup. Why they buy this.
The turning point: stop selling, start educating
This audience doesn't trust ads — but it does trust editorial. So the whole funnel changed: the ad looked like an article preview from a health publication, it clicked through to a long-form advertorial (1,500–2,000 words, PubMed citations, expert positioning), and only then to the product page. Ads ran from publisher-style pages rather than the brand page, so the content read as editorial, not promotion. Costs dropped dramatically — and now there was a formula worth scaling.
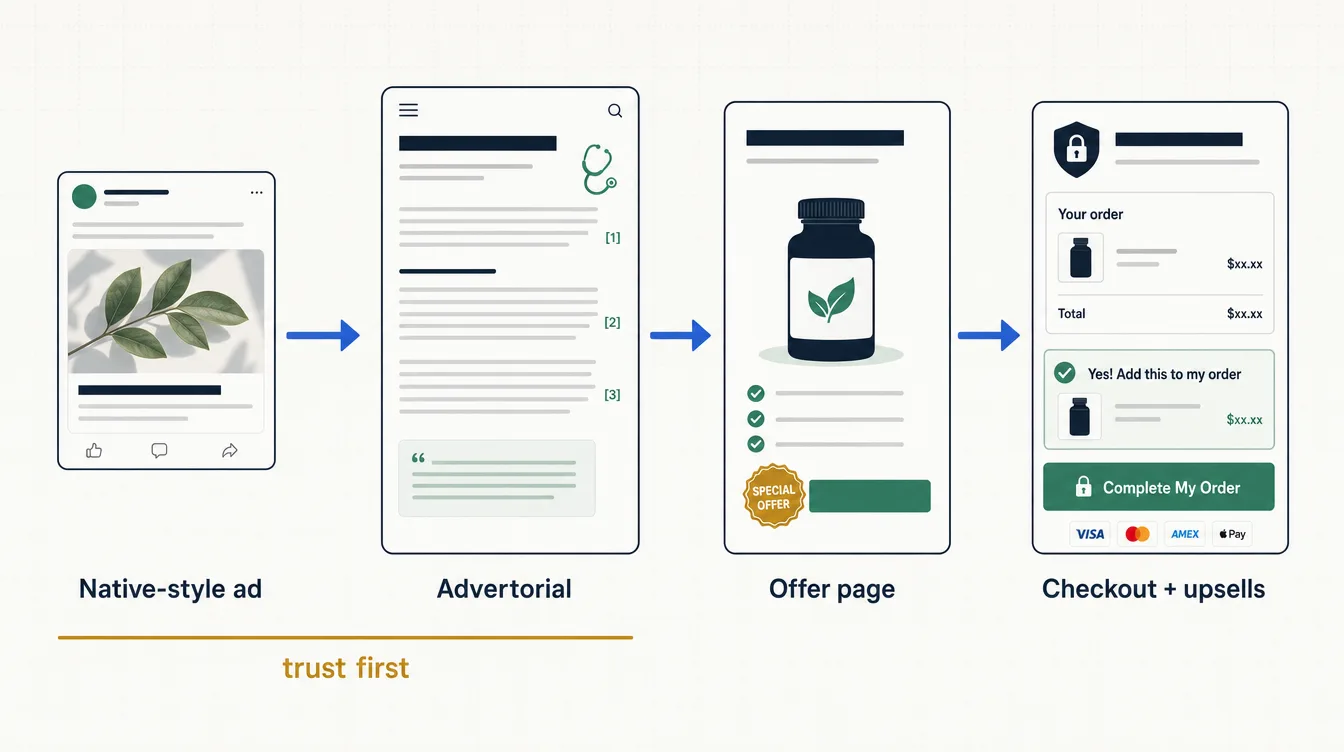
The system at scale
Scale came from structure, not luck. Spend was distributed across four ad accounts — both for policy risk (in health, an account can go down any week) and to avoid the delivery ceilings that appear past ~$10K/day on a single account. Every ad was built from a hook-and-angle framework mapped to how aware the buyer already was, and tagged so winners were visible in days, not months:
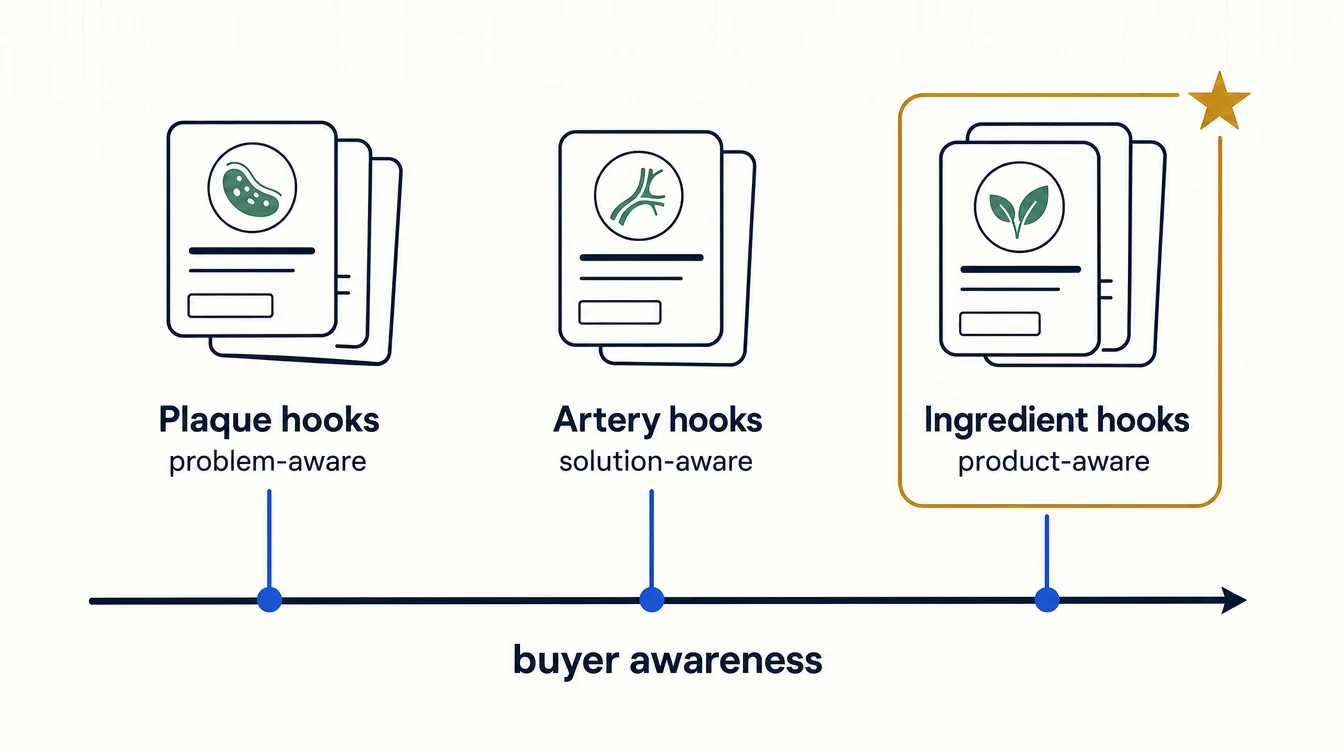
| Hook family | Audience stage | Best cost per purchase |
|---|---|---|
| “Plaque” hooks | Problem-aware | $100.15 |
| “Artery” hooks | Solution-aware | $98.27 |
| “Ingredient” hooks (nattokinase + offer) | Product-aware | $68.88 |
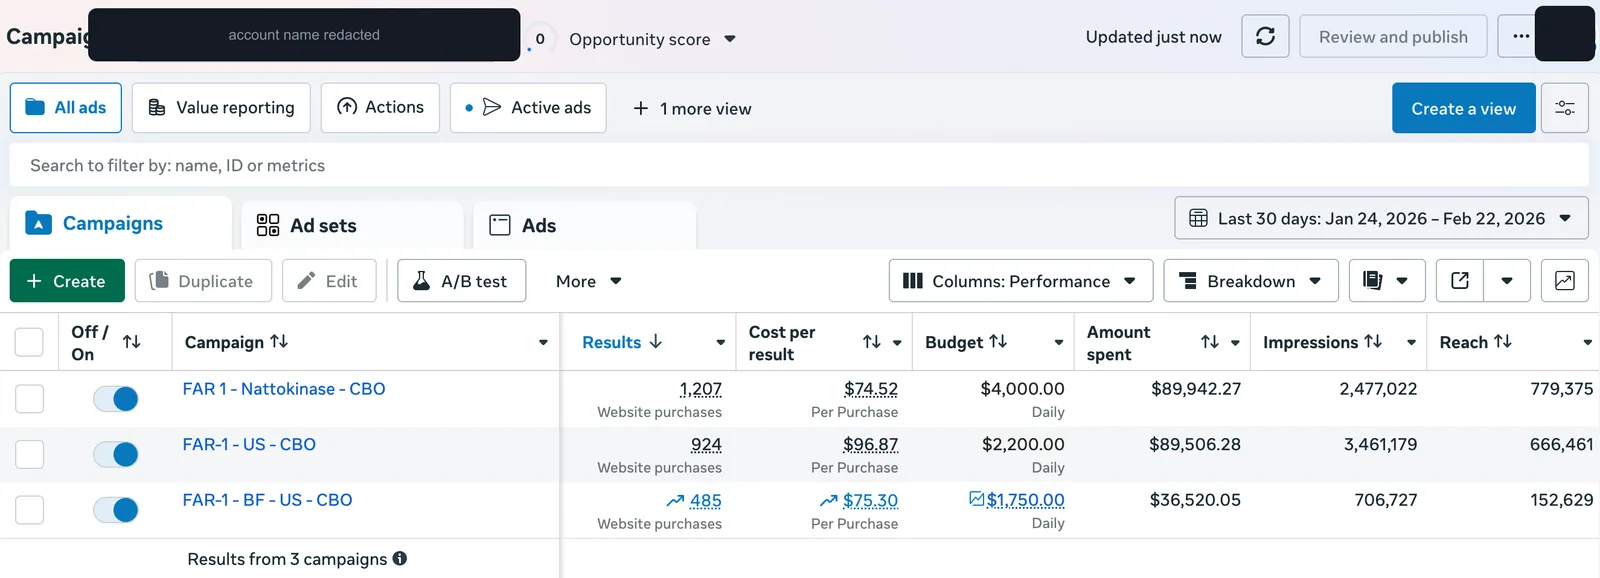
Keeping that engine fed meant testing 1,256+ ad creatives — 776 in the top campaign alone — produced solo with an AI-assisted research and copy workflow. A volume that normally takes a creative team of three or four.
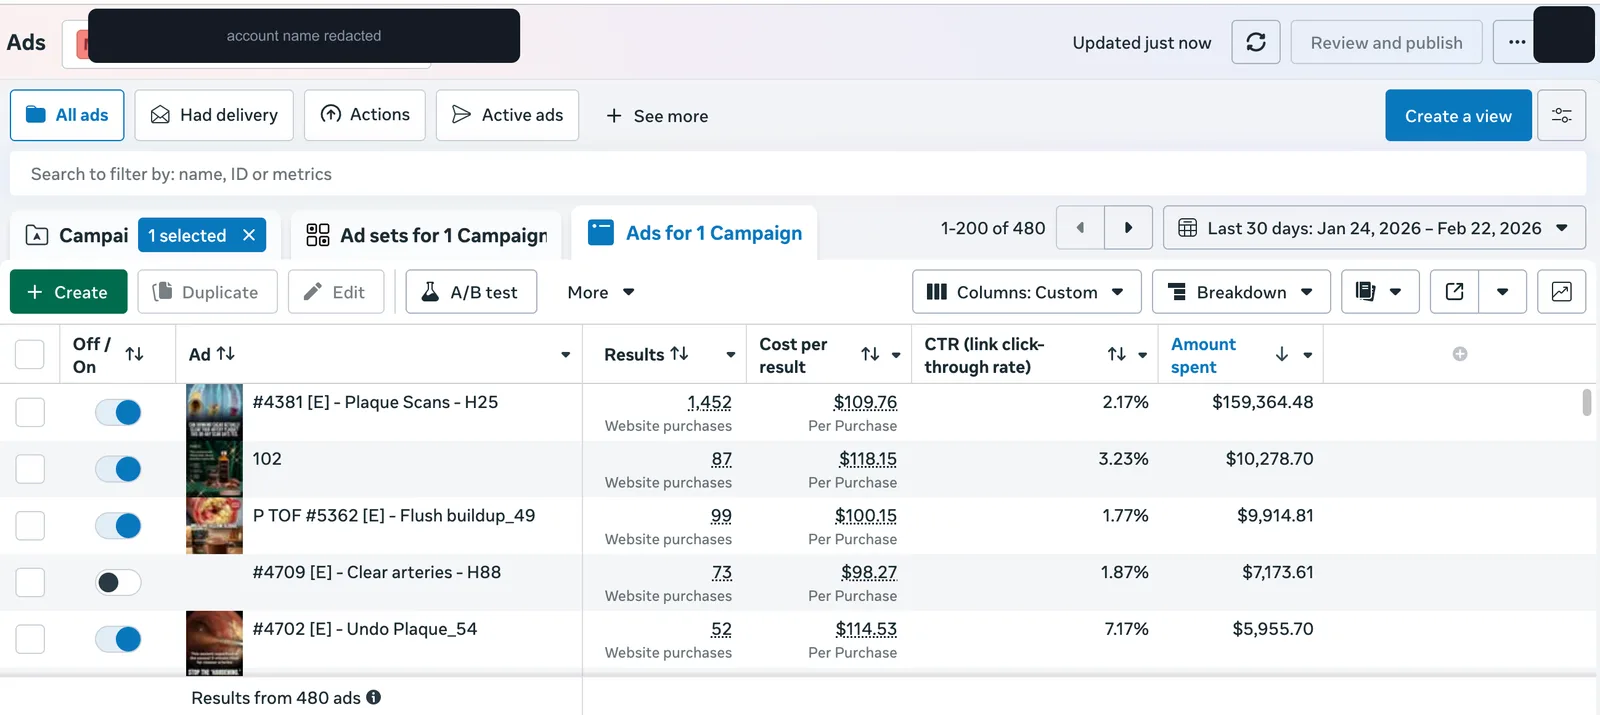
The 30-day window, documented
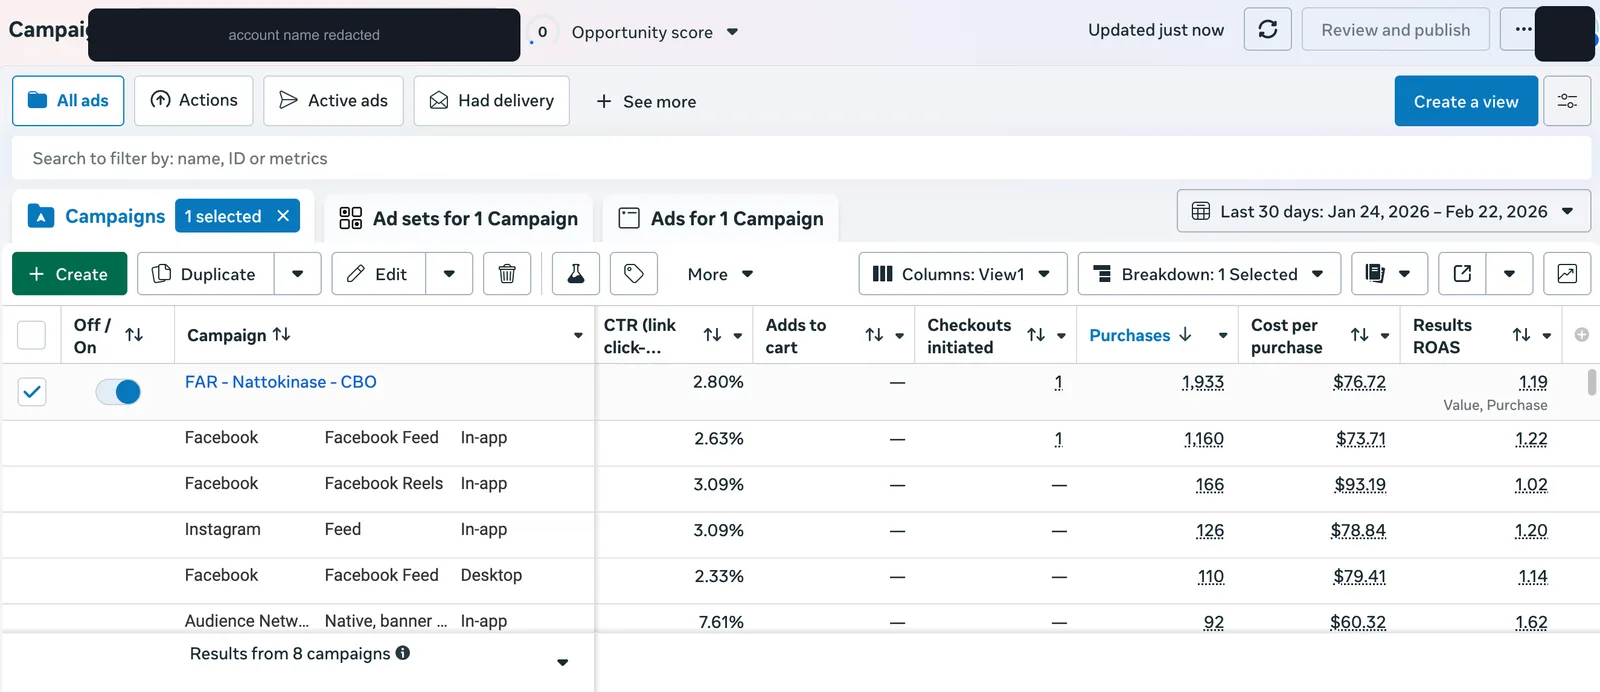
In the documented 30-day window (Jan 24 – Feb 22, 2026), the four accounts spent $839,650 and drove 8,690 purchases at a $96.62 blended cost per purchase — roughly $1.04M in estimated revenue at the $120 average order value.* The best campaign ran 1,933 purchases at $76.72; the best single ad hit $68.88 at 1.39x return on ad spend over $43K of spend.
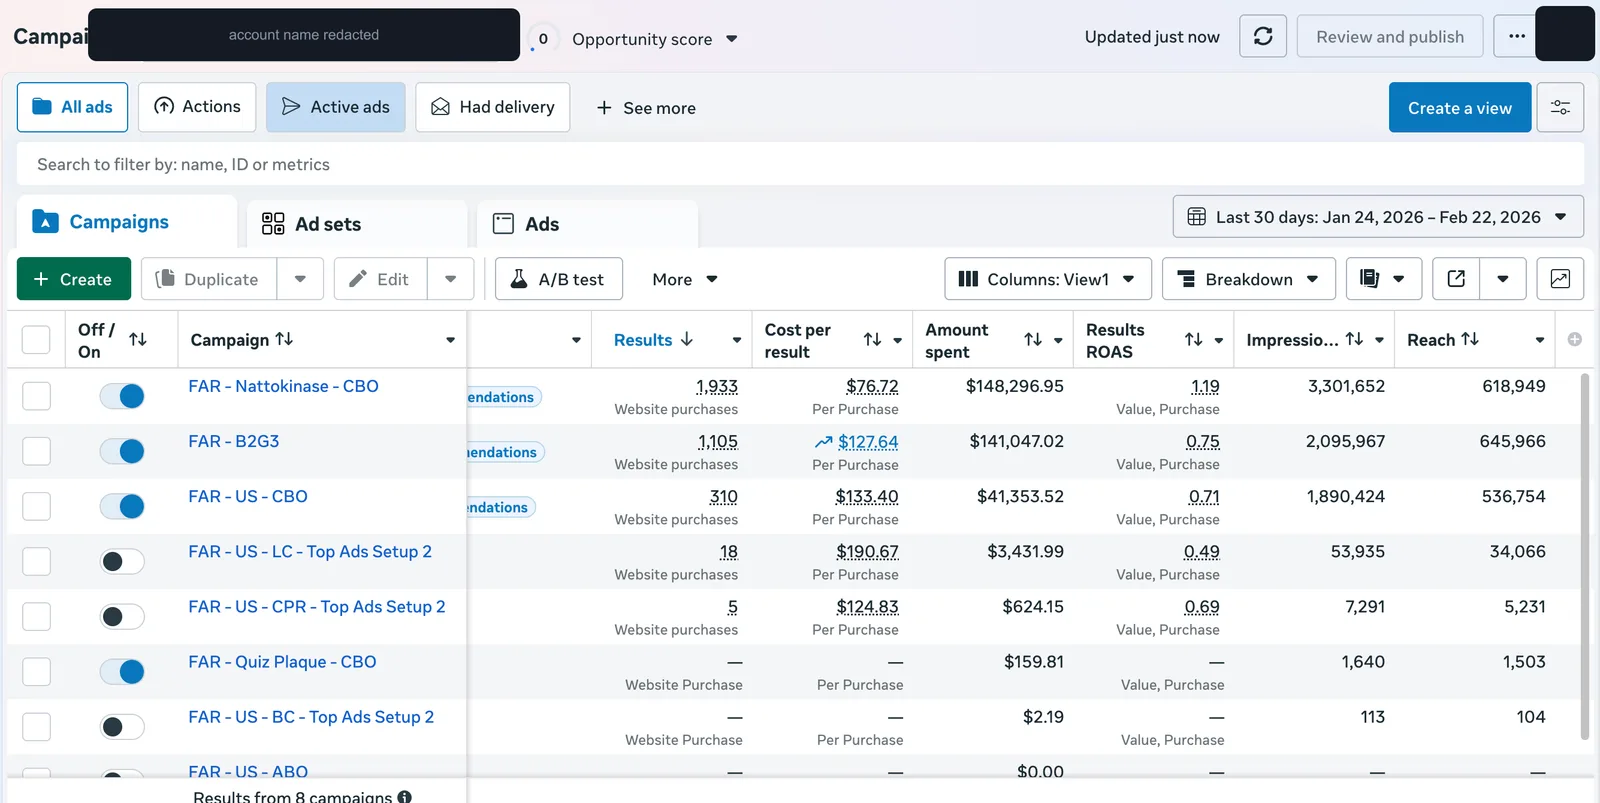
Optimization was read at every layer — placements, demographics, funnel steps. Facebook's mobile feed carried 60% of volume; the native placement (Audience Network) was the quiet efficiency winner at $60.32 per purchase and 1.62x return.
The honest reading
Numbers you can trust are numbers with their caveats attached. Meta's pixel reported 1.19x on the top campaign — but the pixel tracked ~$92 per order while the real average order value, with post-purchase upsells, was $120. Actual return was closer to 1.56x. It cuts the other way too: two campaigns in active testing ran below 1.0x on the pixel during this window. Both facts belong in the report.
And the three things Juan would do differently — written down at the time, not invented later:
- Build the retargeting layer earlier: 92K link clicks a month on one campaign is warm traffic left on the table.
- Scale the 45–54 male segment sooner — the cheapest cohort ($71.40) was getting the least budget.
- Push the Audience Network placement harder — best economics, smallest allocation.
What this proves for your business
Every station of the Irgella Engine is in this story: research before a single ad ran; the offer and funnel fixed before traffic was scaled; campaigns run as tagged experiments with written kill rules; and reporting honest enough to show the losers next to the winners. That's the machine — this is what it looks like at $840K a month.
*Revenue estimated at $120 average order value including post-purchase upsells; Meta-reported ROAS reflects front-end checkout value only. All performance data from Meta Ads Manager, 30-day window Jan 24 – Feb 22, 2026. Brand name withheld under a confidentiality agreement.
Prefer Spanish? The teaching teardown of this case lives in the founder's free library: magoallegri.com — caso-suplementos-meta-ads.